People make great deal of hoopla over Intel’s investments in its new $20 billion semiconductor chip plant1 near Columbus, Ohio, which Intel claims could expand into a $100 billion complex with eight fabrication facilities (fabs). This is of course great news, and pundits are now proclaiming that Intel’s great feat marks the rise of the new Silicon Heartland.2 But, we will need to be patient! Building a semiconductor plant takes more than two years on average -- and often involves painstaking equipment installation, clean room validation, and lots of “copy exactly” procedures -- an Intel mantra to do things the same as you did it last time, because it works.3
So, just how big a dent will Intel’s investments make in our foreign dependence on semiconductors? To answer that, my colleague Jason Miller at Michigan State University looked behind the scenes and performed a few calculations described below. His analysis snugly fits inside two major questions this article considers:
- What is the overall level of capacity utilization for semiconductor production in the United States?
- How do semiconductor organizations like Intel contribute to the semiconductor demand in the United States?
No doubt the answer to the first question emerges into an important first step considering how the Department of Defense and other industries have emphasized the importance of reducing our dependence on foreign semiconductors. With most global production emerging from Taiwan (TSMC) and Korea (Samsung) -- the geopolitical risks of China and North Korea in these regions is worrying.
As shown in Figure 1, the utilization rate for semiconductors has hovered around 90-95% for most of 2020; then it then dropped to 85% in 2020, likely due to sudden worker shortages and COVID outbreaks. This can be interpreted as essentially full capacity. Most people working within almost all fab operations realize that you can’t normally run a facility at more than 85%, especially considering the maintenance requirements; stoppages due to supply chain disruptions; material and labor shortages; and a host of other issues.
We know this because the Census of Manufacturers4 tells us that the broader computer and electronics product manufacturing sector is being hammered by labor and parts shortages (see Figure 2). So, this tells us that we are at full capacity already with our domestic producers.
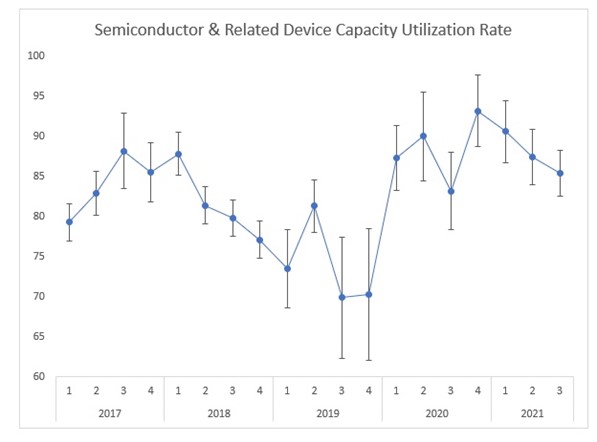
Figure 1. Utilization rate for semiconductor and related devices
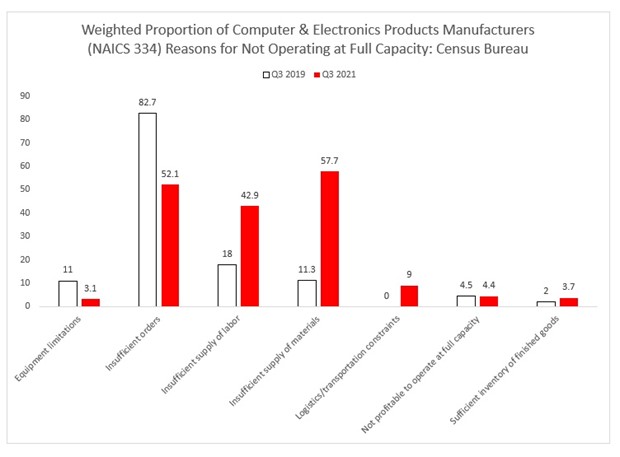
Figure 2. Research supporting reason why we cannot operate at full capacity (Reference: North American Industry Classification System (NAICS) 3344 United States Census Bureau).
The National Bureau of Economic Research (NBER) and the Center for Economic Studies5 partnered to maintain a database containing 60 years of detailed manufacturing data. 6 Employment in March 2020 was 103,000, down from 229,500 in March 2020. See Figure 3 and notice how Figure 4 generally correlates with this data by showing value of shipments between the same period,1958 to 2000.
Likewise, nominal output in 2020 was $53.6 billion in 2020, down from $90.9 billion in 2000. For comparison, this means than Intel's two new fabs outside of Columbus represent a less than 3% increase in semiconductor manufacturing’s employment, assuming that the complex will employ 3,000 people, as mentioned in the Wall Street Journal article.7
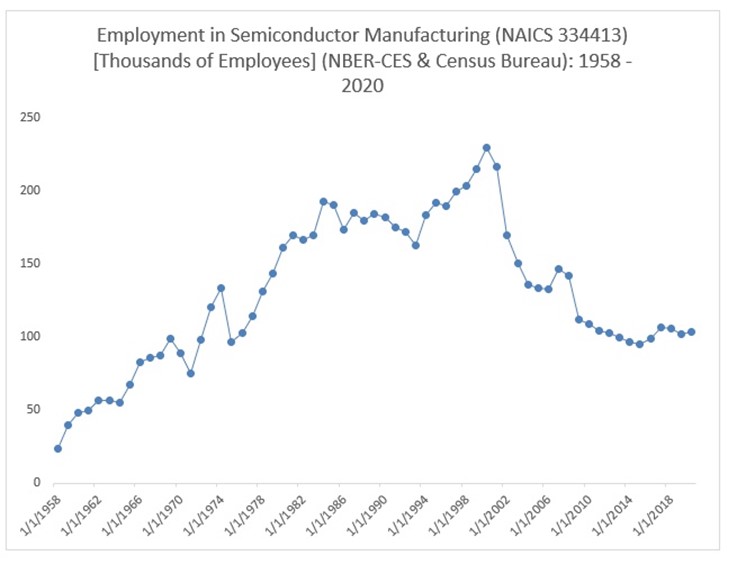
Figure 3. Employment Statistics 1958 to 2020
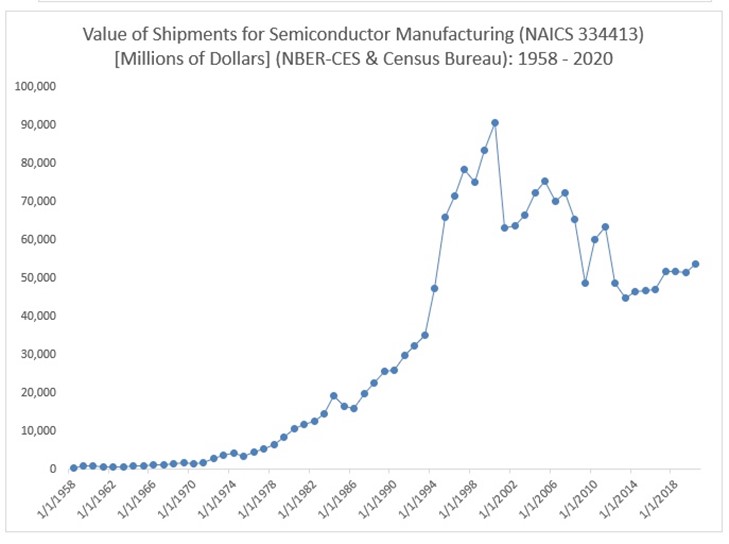
Figure 4. Value of Shipments for Semiconductor Manufacturing 1958 to 2020
How do these semiconductor organizations contribute to the semiconductor demand in the United States?
This inspires speculation! From the 2017 Economic Census8 Jason pulled data on industry concentration in semiconductor manufacturing showing the number of establishments9 operated by the 4, 8, 20, and 50 largest firms (shown in Table 1). Intel currently has 4 fabs in the U.S. So, we can guess 100% probability exists in Intel's plants within the four largest firms’ category. The employees per establishment seems reasonable.
One can then estimate that the output per facility is approximately $1.7 billion dollars per fab. Output in 2017 was $51.8 billion. Intel is promising10 this will be the largest fab complex it has when it is up and running, so let’s assume we are looking at an output of at least $2-3 billion for the new facilities. Putting this all together, Intel’s new facilities would constitute a four to six percent increase in US output.
At purchasers' prices, total domestic demand for semiconductors in 2012 per the Detailed Use Table was $57.11 billion; we exported $27.3 billion, which brings us to the same value as the total product supply at producer prices. Using that figure of $57.11 billion in 2012 and assuming 2019 was the same, that puts 2021's demand at approximately $68.5 billion.
We can say $2 to 3 billion of production is certainly a start. But we are still a long way off from being globally dependent on foreign semiconductor manufacturing. We need to begin finding ways to increase capital investments in new fab production in this country. It’s high time we become globally independent on a critical resource that is required to take us into the digital age.
Table 1 – Sales value of top 4 largest, top 8 largest, top 20 largest, and top 50 largest firms, captures how all of this is looking today.
|
Meaning of firm, concentration code
|
Number of firms
|
Number of establish-ments
|
Sales value of shipments or revenue ($1,000)
|
Annual payroll ($1,000)
|
First quarter payroll ($1,000)
|
Number of employees
|
Employees per establish-ment
|
Sales per establishment
|
|
All firms
|
737
|
816
|
51,830,460
|
11,330,551
|
3,172,738
|
106,050
|
130
|
$63,517,721
|
|
4 largest firms
|
4
|
14
|
22,660,632
|
4,596186
|
1,409,232
|
36.606
|
2,615
|
1,618,616,571
|
|
8 largest firms
|
8
|
26
|
31,106,538
|
6,889,646
|
1,951,091
|
52,612
|
2,024
|
1,196,405,308
|
|
20 largest firms
|
20
|
58
|
40,338,083
|
8,322,398
|
2,343,947
|
70,339
|
1,213
|
695,484,190
|
|
50 largest firms
|
50
|
110
|
46,891,614
|
9,843,244
|
2,785,142
|
87,309
|
794
|
426,287,400
|
END NOTES
-
Intel’s investments in its new $20 billion semiconductor chip plant
-
Intel CEO ‘thrilled to be launching the Silicon Heartland in Ohio’, Tech plore, CC0 public domain
-
Intel’s culture Needed Fixing. It’s C.E.O. is Shaking Things Up, Robert Swan
-
Reference North American Industry, Classification System
-
National Bureau of Economic Research and the Center for Economic Studies
-
My comment: I merged this data with the 2019 and 2020 Annual Surveys of Manufacturers with years ending in 2 and 7 being the Economic Census. See also article by United States Census Bureau tited Census Bureau Releases 2020 Annual Survey of Manufacturer Data
-
Intel to Invest at Least 20 billion in Ohio Chip-Making Facility
-
2017 Economic Census
-
Intel article titled How Many Fabs does Intel have?
-
Article title Intel selects Ohio for ‘largest silicon manufacturing location on the planet’: The Verge, Jon Porter, Jan 21, 2022
ABOUT THE AUTHORS
Robert Handfield is the Bank of America University Distinguished Professor of Supply Chain Management at North Carolina State University, and director of the Supply Chain Resource Cooperative (SCRC). He also serves as an Adjunct Professor with the Supply Chain Management Research Group at the Manchester Business School. He is the Consulting Editor of the Journal of Operations Management, one of the leading supply chain management journals in the field and is the author of several books on supply chain management, the most recent being Supply Market Intelligence, Supply Chain Re-Design and Introduction to Supply Chain Management (Prentice Hall, 1999, 25,000 copies sold, and translated into Chinese, Japanese, and Korean). He has co-authored many textbooks.
Jason Miller is a passionate educator who helps practitioners and students better understand industry trends through data. He leverages his decade of experience as an academic researcher and statistician to identify highly reliable data sources and process data to ensure data clarity so that it is more easily understood by those in industry (e.g., explaining the jargon, applying seasonal adjustments, transforming data to remove effects of inflation, etc.). He focuses mostly on topics that pertain to supply chain management, with a special emphasis on the for-hire trucking sector.